Linux
SNMP Performance Data Observability with Grafana — DevMon Update
Preface Tools and platforms that can observe hardware device performance data are countless; there are plenty of excellent companies and teams flocking to this
Preface
Tools and platforms that can observe hardware device performance data are countless; there are plenty of excellent companies and teams flocking to this (in a pejorative sense? Sorry, I'm running out of words, I just want to convey that something is hot). I won't be fussy—you walk your broad avenue, I'll build my Hello World, entertaining myself, just not idle.
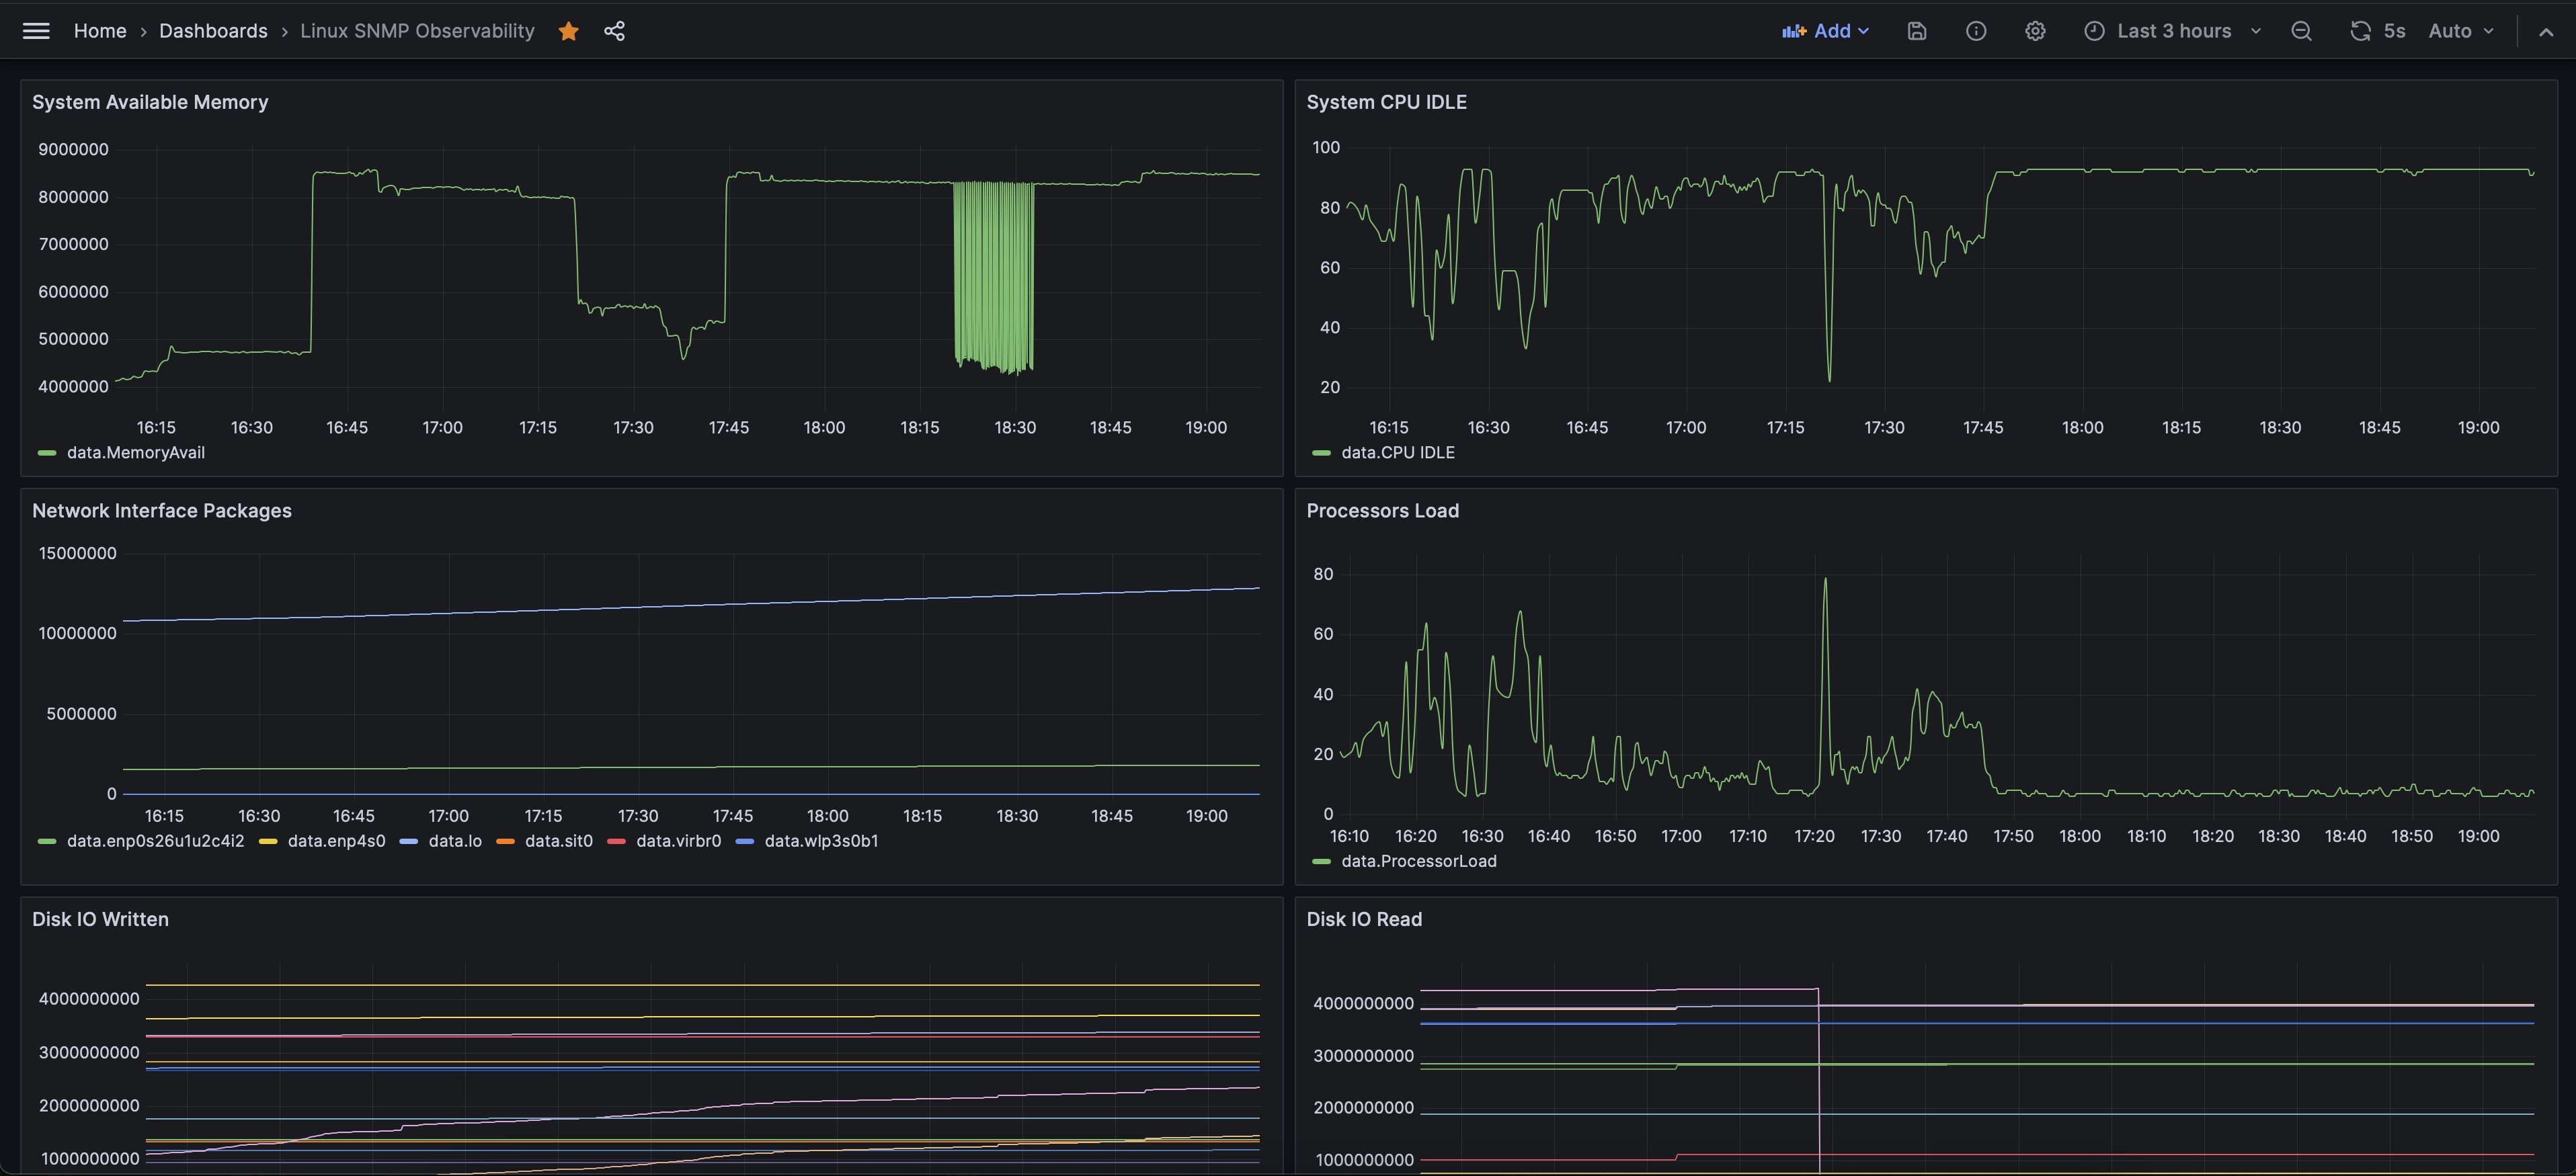
Effect Diagram
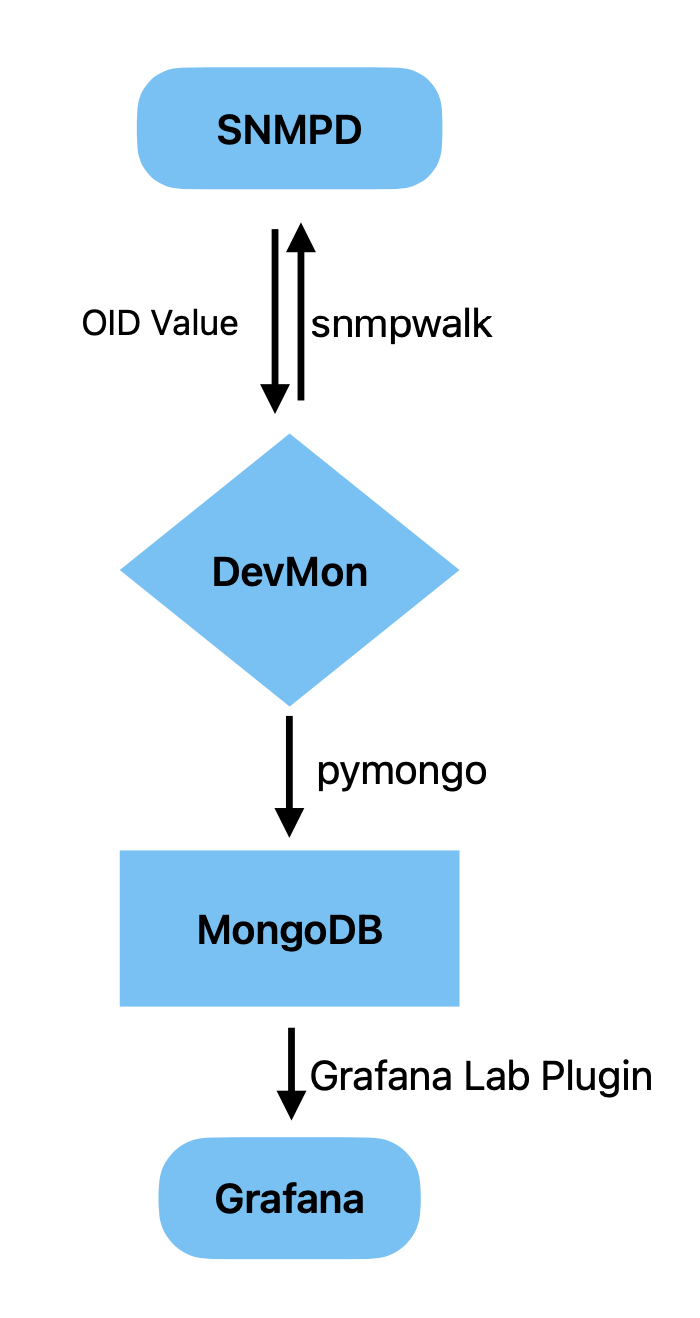
Overall Logic
DevMon Performance Configuration Example
- table: 'hrSWRunPerfCPU'  # required, at the same level as id / id_range in the common config
  table_index: 'hrSWRunIndex'  # optional
  label: 'SW Running CPU Stat'  # required, used to filter MongoDB data
  related_symbol: 'hrSWRunName'  # optional, reads sub-item names from the table; if absent, 'label' is used as the name
  perf: True  # required, distinguishes hardware state from performance
MongoDB Cloud Application and Data Types
1. Apply for MongoDB Atlas
2. MongoDB Atlas User and Security Configuration
SECURITY → Database Access → Database Users
3. MongoDB Time-Series Collection Data Type Example
{
  "timestamp": {
    "$date": "2023-11-01T07:03:59.837Z"
  },
  "metadata": {
    "address": "localhost",
    "area": "SomeArea",
    "label": "NIC",
    "region": "SomeRegion"
  },
  "_id": {
    "$oid": "6541f861813030e60078af7d"
  },
  "data": {
    "lo": 10606321,
    "enp4s0": 0,
    "sit0": 0,
    "wlp3s0b1": 0,
    "virbr0": 16,
    "enp0s26u1u2c4i2": 1511637
  }
}
Grafana Cloud Configuration
1. Install the MongoDB Plugin
Administrator --> Plugin
2. Add MongoDB Data Source
Connections --> Data Sources
Grafana Data Source Query Example
DATABASE.COLLECTION.find({"metadata.label": "NIC"})
# Here label is consistent with the label value in the MongoDB time-series collection data type
Source Code
◆
评论Comments
加载中…Loading…
留下评论Leave a comment